 |
| Levels of Hell as depicted from Dante's Inferno. |
While doing research for The Rainy Day Murders, Ryan M. Place, came across the work of UCLA engineering researcher Dr. Mikhail Simkin. He has been studying the biological rhythm of serial killers. His theory is that "serial killers commit murder when the neuronal excitation in their brains exceed a certain threshold."
Ryan emailed Dr. Simkin and asked if the professor could plot out a graph of John Norman Collins' inter-murder intervals and help us draw some conclusions about his behavior.
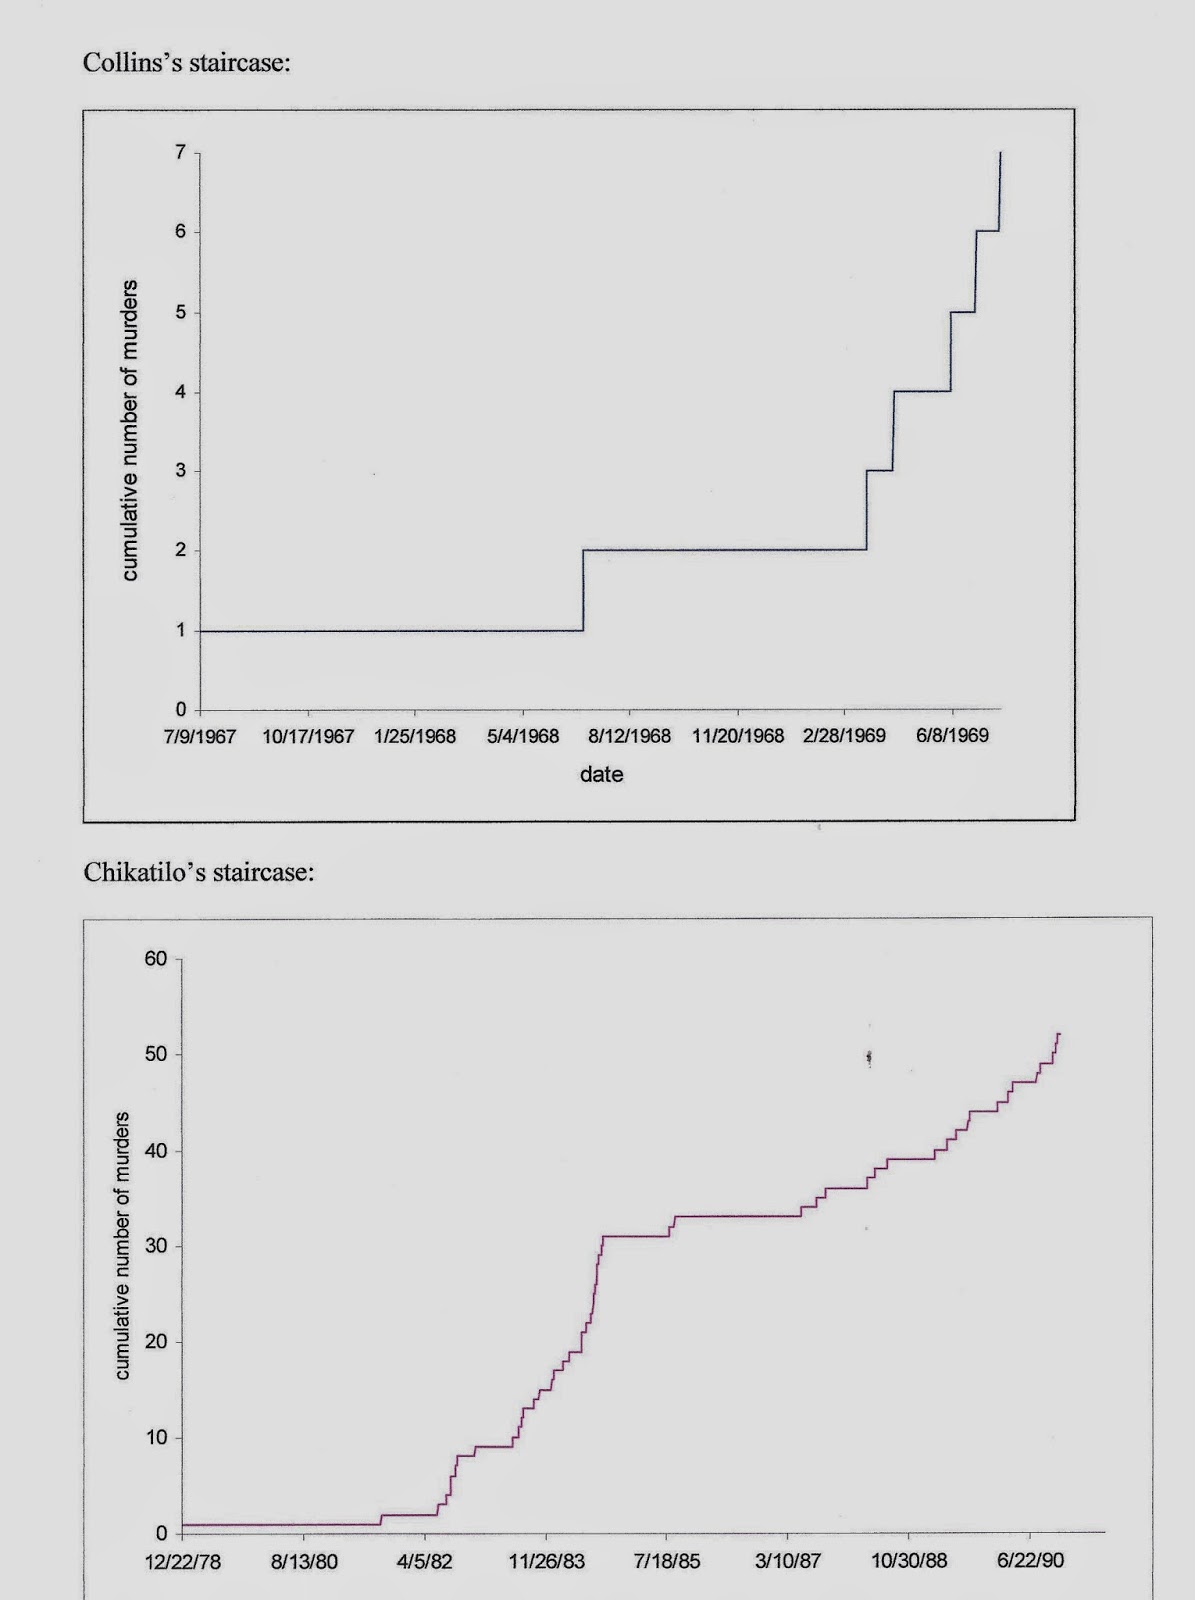
Dr. Simkin wrote back stating, "Because of the limited data of seven murders and six intervals, it is out of the question to plot a probability distribution of inter-murders for Collins. The only plot we can do is that of cumulative number of murders as a function of the dates. The Collins chart can't stand on its own."
In his response to us, Dr. Simkin included an attachment of the Collins plot graph and the plot graph of Russian Andrei Romanovich Chikatilo, thought to be the most prolific serial killer in history. He was convicted in 1990 for the murders of fifty-three women and children and executed with a gunshot behind the right ear in 1994. The Russian newspapers dubbed him "The Butcher of Rostov."
Dr. Simkin did a narrative comparison of both charts for us. "You can see that the Collins plot has some properties of the 'Devil's staircase' as there is a large step variation," he wrote. "The longest step is 15.5 times bigger than the shortest. However, for the Chikatilo plot, this ratio is 329 times bigger.... In the Collins plot, we can glimpse some features of the Devil's staircase which are far better developed in the Chikatilo plot."
"The Devil's staircase" is a statistical term referring to graph results that resemble a staircase of increasing values when plotted out. Mathematically, the results depict "a function not absolutely continuous." But the term also carries some metaphorical significance when you consider the subject matter under discussion, serial murder.
Both plot graphs show a behavioral trait common to most serial killers. As their murders increase, the intervals between the murders decreases. It is this grim logic of serial killers that often leads to their eventual undoing. As the body count rises, authorities have more data to work with and the killer's profile begins to take shape. When serial killers become overconfident in their abilities, they begin to feel immune to capture and make mistakes.
How much time it takes to solve these crimes varies with the circumstances of each case of course. Some cases are never officially solved. In the case of John Norman Collins and the six other murders he was thought to have committed, he was only convicted of the seventh and last murder. For the other six families, there has been no closure.
No comments:
Post a Comment